对于一个程序员而言,一般我们的追求包括:稳定性、效率、效果。而profiling就是我们优化效率的重要步骤——瓶颈发现。profiling,在软件工程中的意思大体接近于【性能分析、瓶颈分析】,也就是去看代码运行过程中在各个环节中耗费的时间。
注意,这里profiling只是发现瓶颈的一个选项,而且是一个保底但是通用的选项。如果天赋异禀或者经验老到,完全可以靠经验或灵感发现问题,比如变量反复申请、进程线程session等反复创建、list加in操作、多重循环、gpu-cpu数据交换频繁等等,这个我们甚至可以单开一个文档来写。
这份文档我们针对python-profiling介绍三个工具,本篇中的profiling我们默认以以下代码为例:
find_x.py
1
2
3
4
5
6
7
8
9
10
11
12
13
# encoding: utf-8
import numpy
import torch

long_list = list(range(1000000))


def find_x(x):
    y = numpy.random.rand(2000, 100)
    len_y = y.sum()
    x in long_list
    y = torch.rand((2000, 10)).cuda()
demo.py
1
2
3
4
5
6
7
8
9
10
11
12
13
14
15
16
17
18
19
20
21
22
23
# encoding: utf-8
import random
import time

from tqdm import tqdm

from finx_x import find_x


def run():
    """
    这个函数慢的点在于在长list中进行in操作
    """

    for _ in tqdm(range(100)):
        idx = random.randint(0, 1000000 - 1)
        find_x(idx)
        time.sleep(0.01)


if __name__ == '__main__':
    run()
(对,我也想吐槽——这么简单的代码还要拆成两个文件。然而为了展示跨文件的效果,就忍了吧。)
line-profiler
line-profiler是我们比较早使用的工具,通过装饰器实现,需要开发人员在想要profile的函数上添加@profile装饰器。其输出较为友好,虽然是terminal上的。
然而line-profiler终究还是有一系列问题的,比如:
- 侵入式修改:必须在代码上添加相应的
@profile标签 - 递进式的profile过程:需要逐次递进进行profile,而非一键获取所有递归结果,例如,我们通过
@profile标签获取了一个函数的结果,然而发现其瓶颈在于调用另一个函数,这时候我们需要给另一个函数也添加@profile标签,并且重新运行 ,还是比较烦的 - 无法对已经运行的代码(比如一个服务)进行profile:这是由其实现机制决定的
- 干扰运行速度:代码运行时间会变成之前的1.6倍
因此,我们非常希望替换掉line-profiler
py-spy
简介
官网见:https://github.com/benfred/py-spy
安装方法很简单
1
pip install py-spy
py-spy是一种不侵入式的方法,类似cProfile,和line-profiler是两个路线
有另一个类似的叫pyflame,之前是uber维护的,现在停止维护了,不知道是不是被py-spy干掉了。
顺道说一下,如果一个开源项目不维护了(比如被archived了,或者),尽量不要用了,不维护了可能是人手不足,可能是有其他更好的替代品……原因很多,但是结果就是出了问题没人修复,所以尽量不要依赖不维护的项目
py-spy的原理是插针法,也就是通过对当前程序的采样获取每行代码的执行时所占的比例。采样的实现依赖于system_call获取当前内存状态,通过PyInterpreterState和PyFrameObject获取调用栈信息(从而能获取其上一级函数和更上层的函数,是火焰图的基础)
使用方法见项目主页,这边我们只做一个样例
第一种典型用法
1
py-spy record -o profile.svg -- python demo.py
也就是对于python function_call_demo.py这个操作进行profile,输出到profile.svg这个文件中。这个操作可以中间停止,也可以指定只运行一段时间,然后自动停止。
我们可以把profile.svg下载到本地然后打开(默认打开应该是浏览器),能看到这样的火焰图(注意,这里展示的是带行号的模式,也就是到行的profiling,也可以到函数,加一个参数-F,参数含义参考help文档):
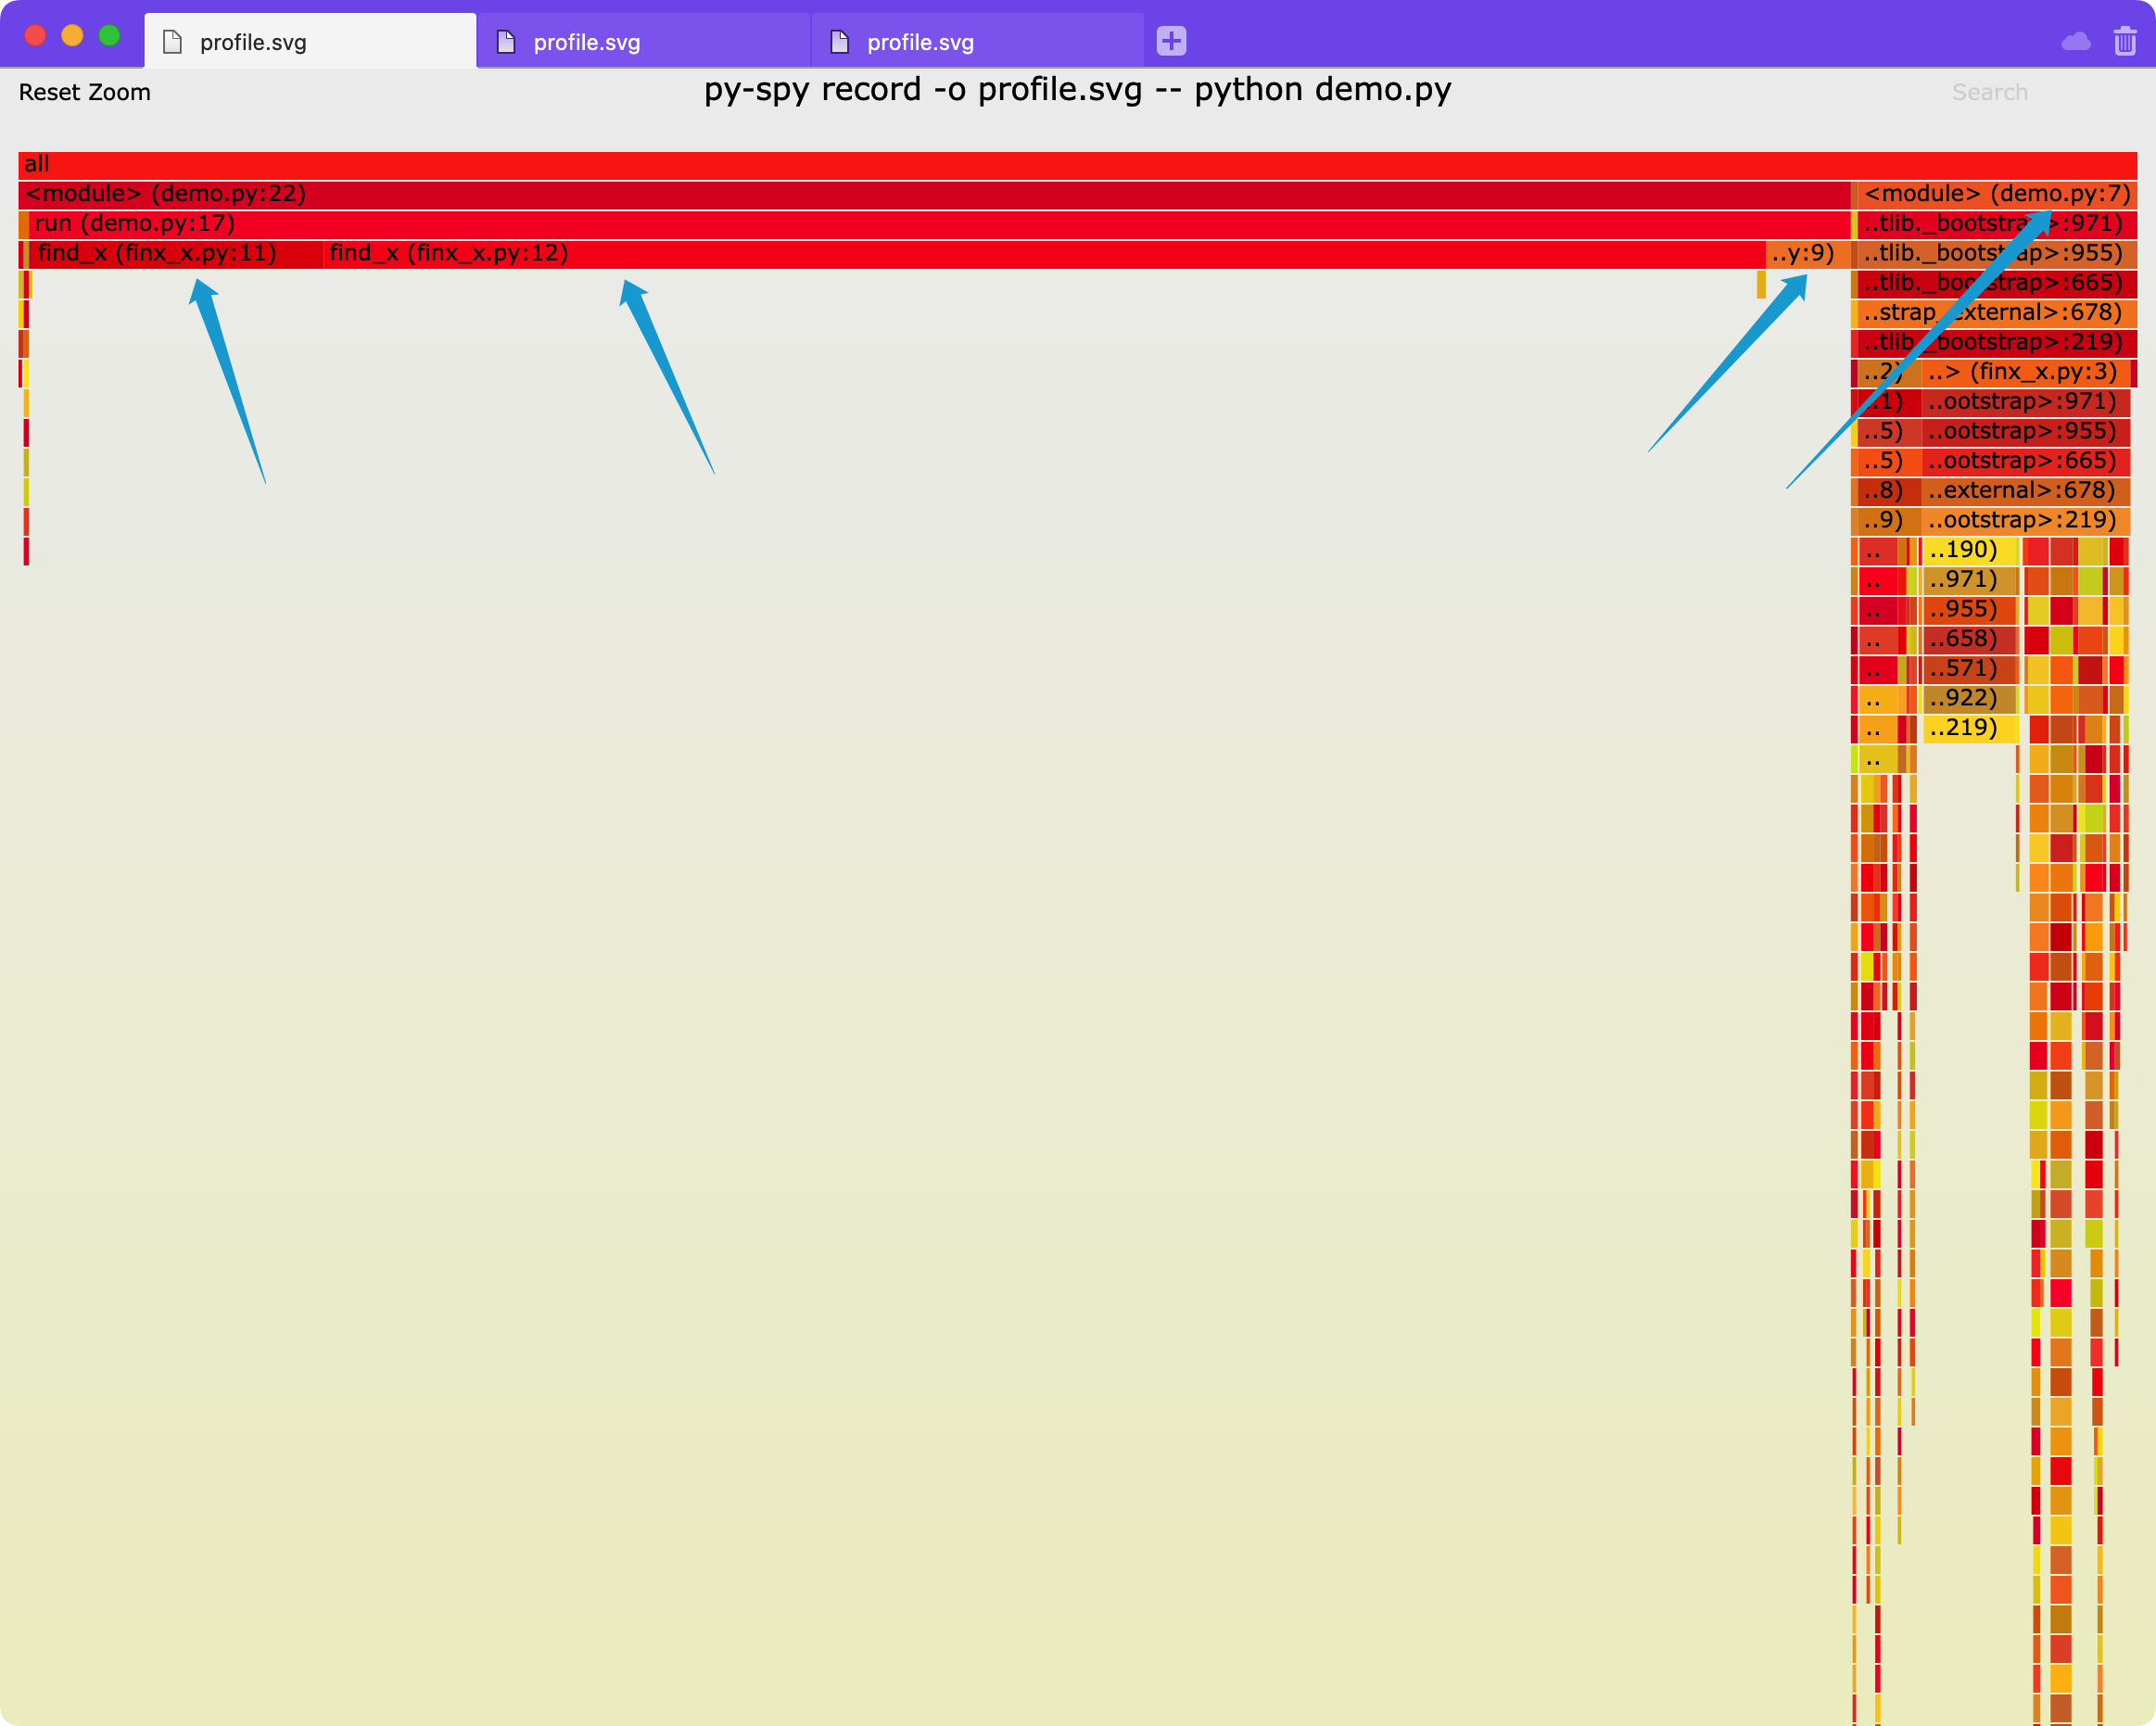
这里我们可以看到有三个瓶颈,分别是find_x文件里的11行、12行、第9行以及demo文件里的第7行,我们看一下代码,分别是list的in操作、初始化torch并转移到gpu、初始化numpy以及初始化long_list,符合预期。
然而这里不太好的一点是,默认不展示time.sleep消耗的时间,原因参见py-spy的readme种的FAQ:https://github.com/benfred/py-spy#how-do-you-detect-if-a-thread-is-idle-or-not
摘录如下:
How do you detect if a thread is idle or not?
py-spy attempts to only include stack traces from threads that are actively running code, and exclude threads that are sleeping or otherwise idle. When possible, py-spy attempts to get this thread activity information from the OS: by reading in
/proc/PID/staton Linux, by using the mach thread_basic_info call on OSX, and by looking if the current SysCall is known to be idle on Windows.There are some limitations with this approach though that may cause idle threads to still be marked as active. First off, we have to get this thread activity information before pausing the program, because getting this from a paused program will cause it to always return that this is idle. This means there is a potential race condition, where we get the thread activity and then the thread is in a different state when we get the stack trace. Querying the OS for thread activity also isn’t implemented yet for FreeBSD and i686/ARM processors on Linux. On Windows, calls that are blocked on IO also won’t be marked as idle yet, for instance when reading input from stdin. Finally, on some Linux calls the ptrace attach that we are using may cause idle threads to wake up momentarily, causing false positives when reading from procfs. For these reasons, we also have a heuristic fallback that marks known certain known calls in python as being idle.
You can disable this functionality by setting the
--idleflag, which will include frames that py-spy considers idle.
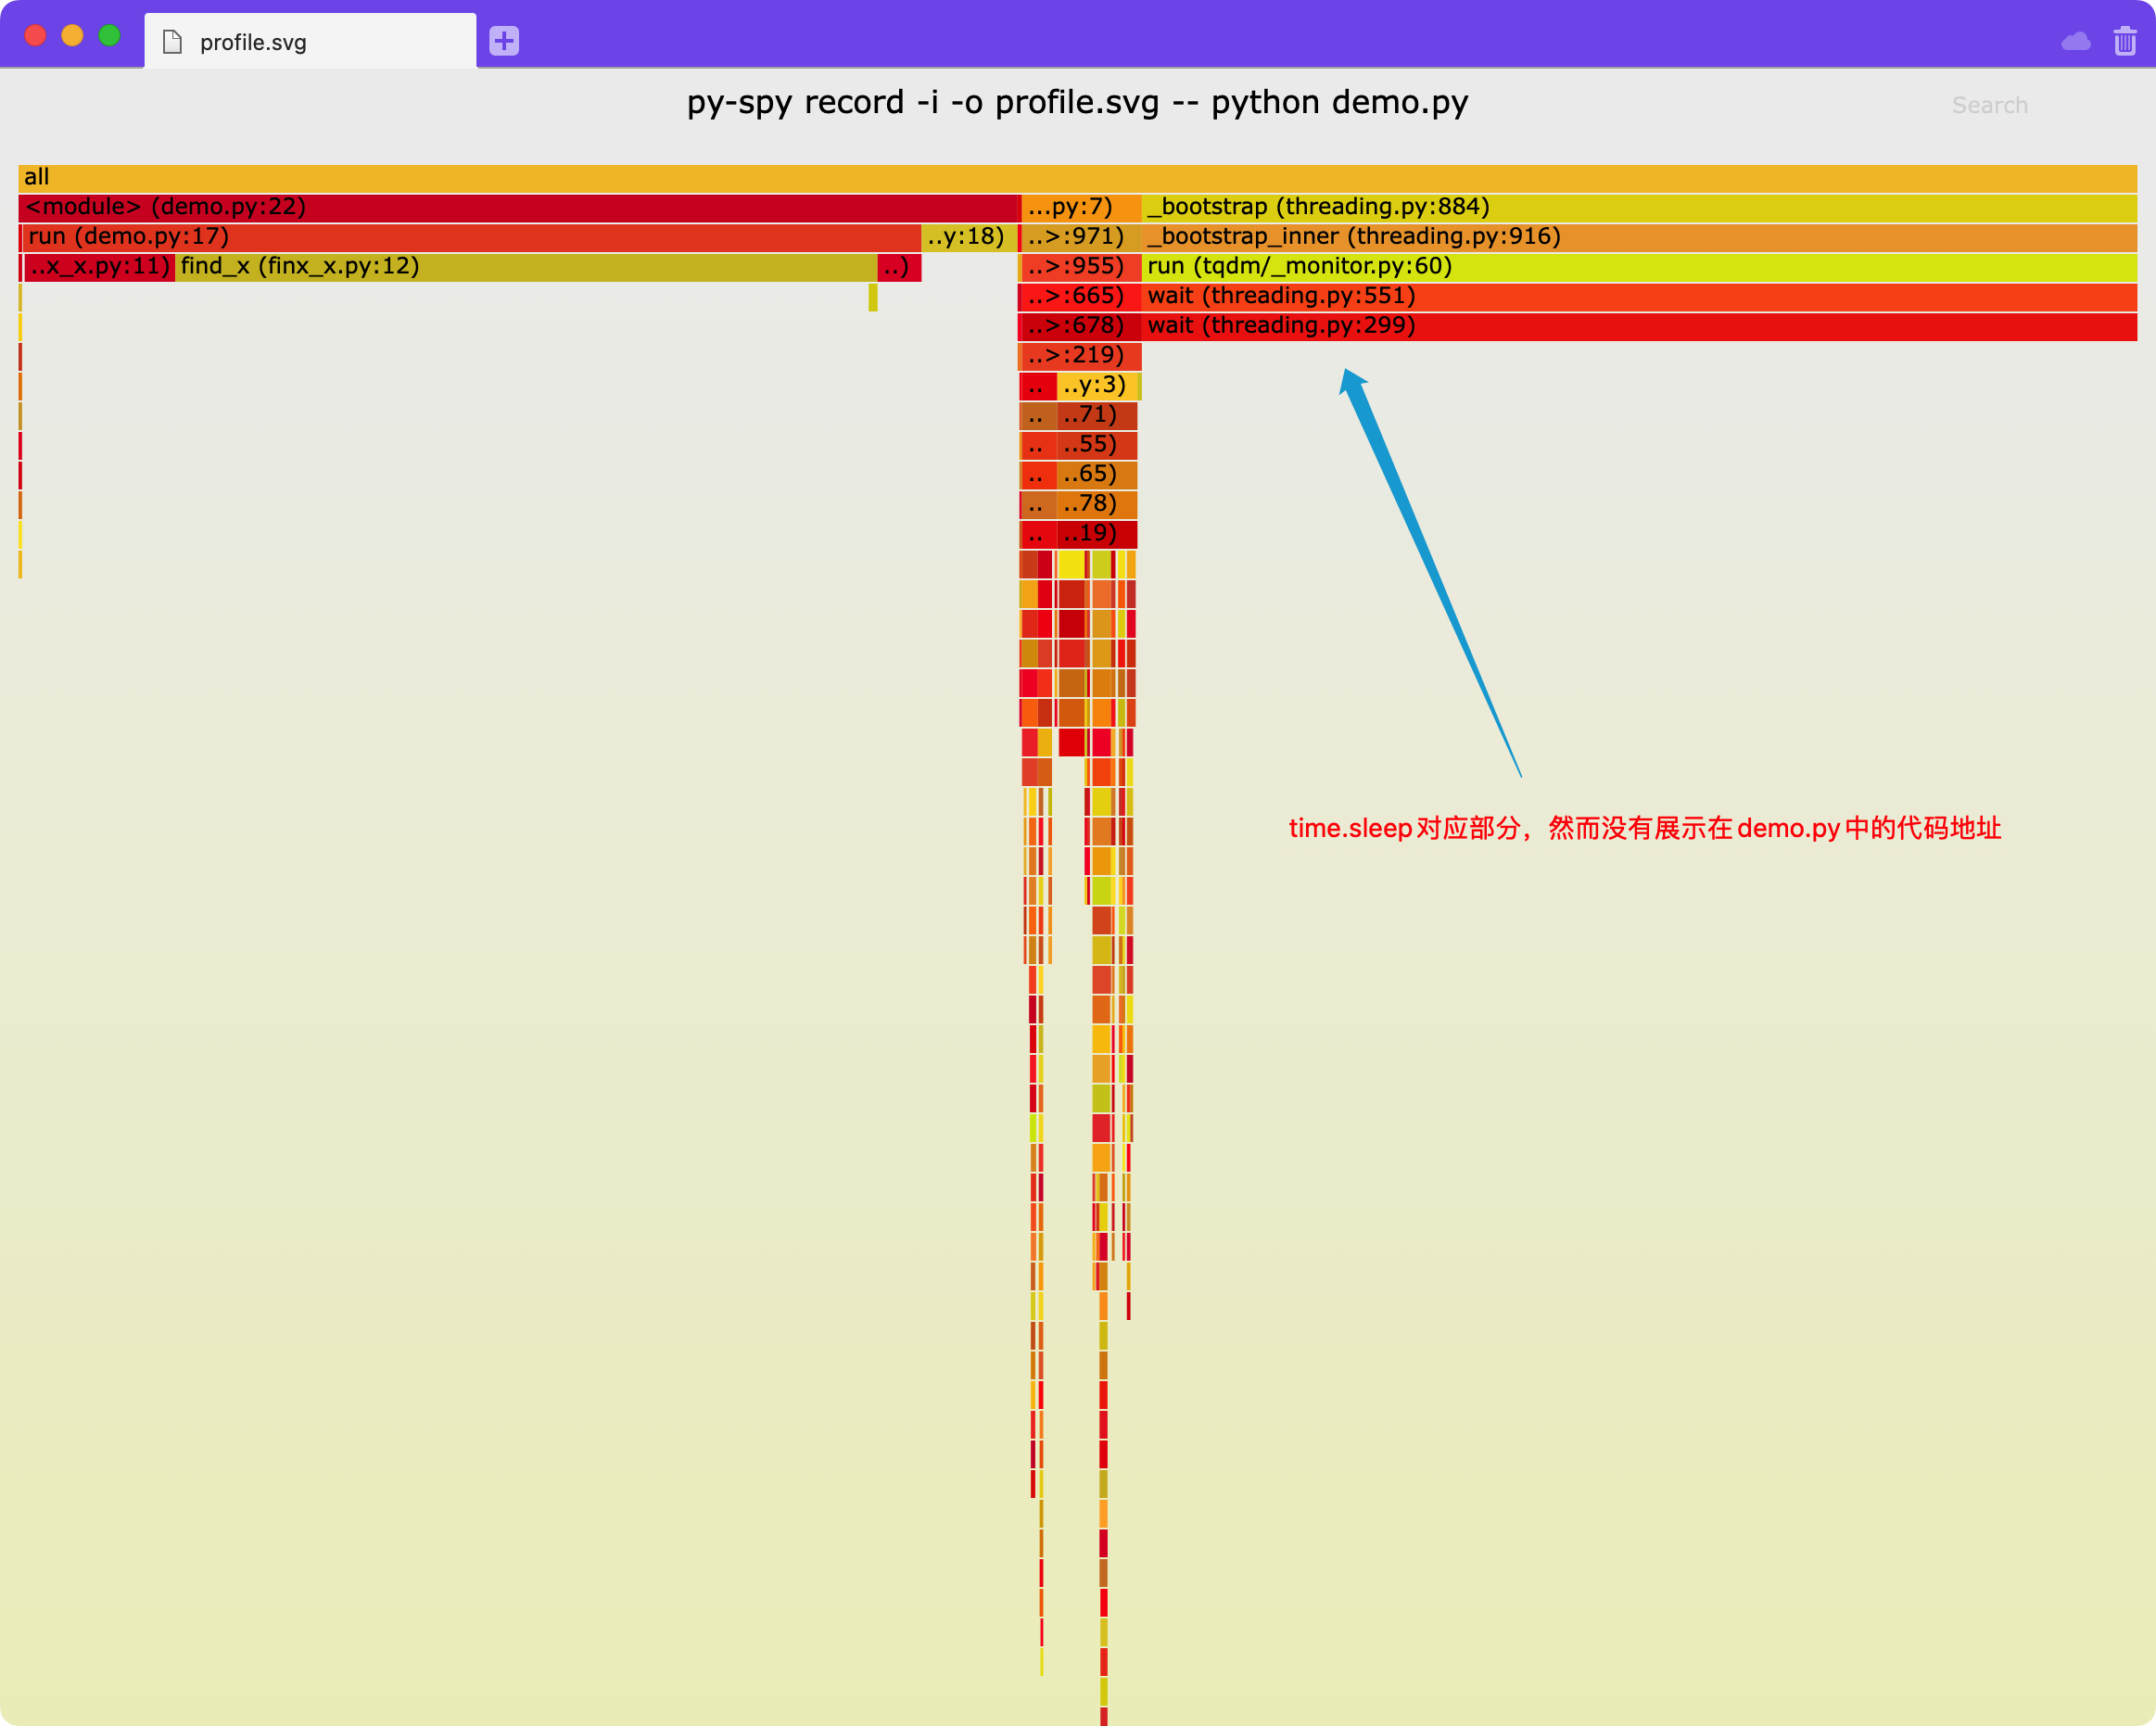
我们可以通过增加-i参数来让py-spy展示这部分空闲(idle)时间
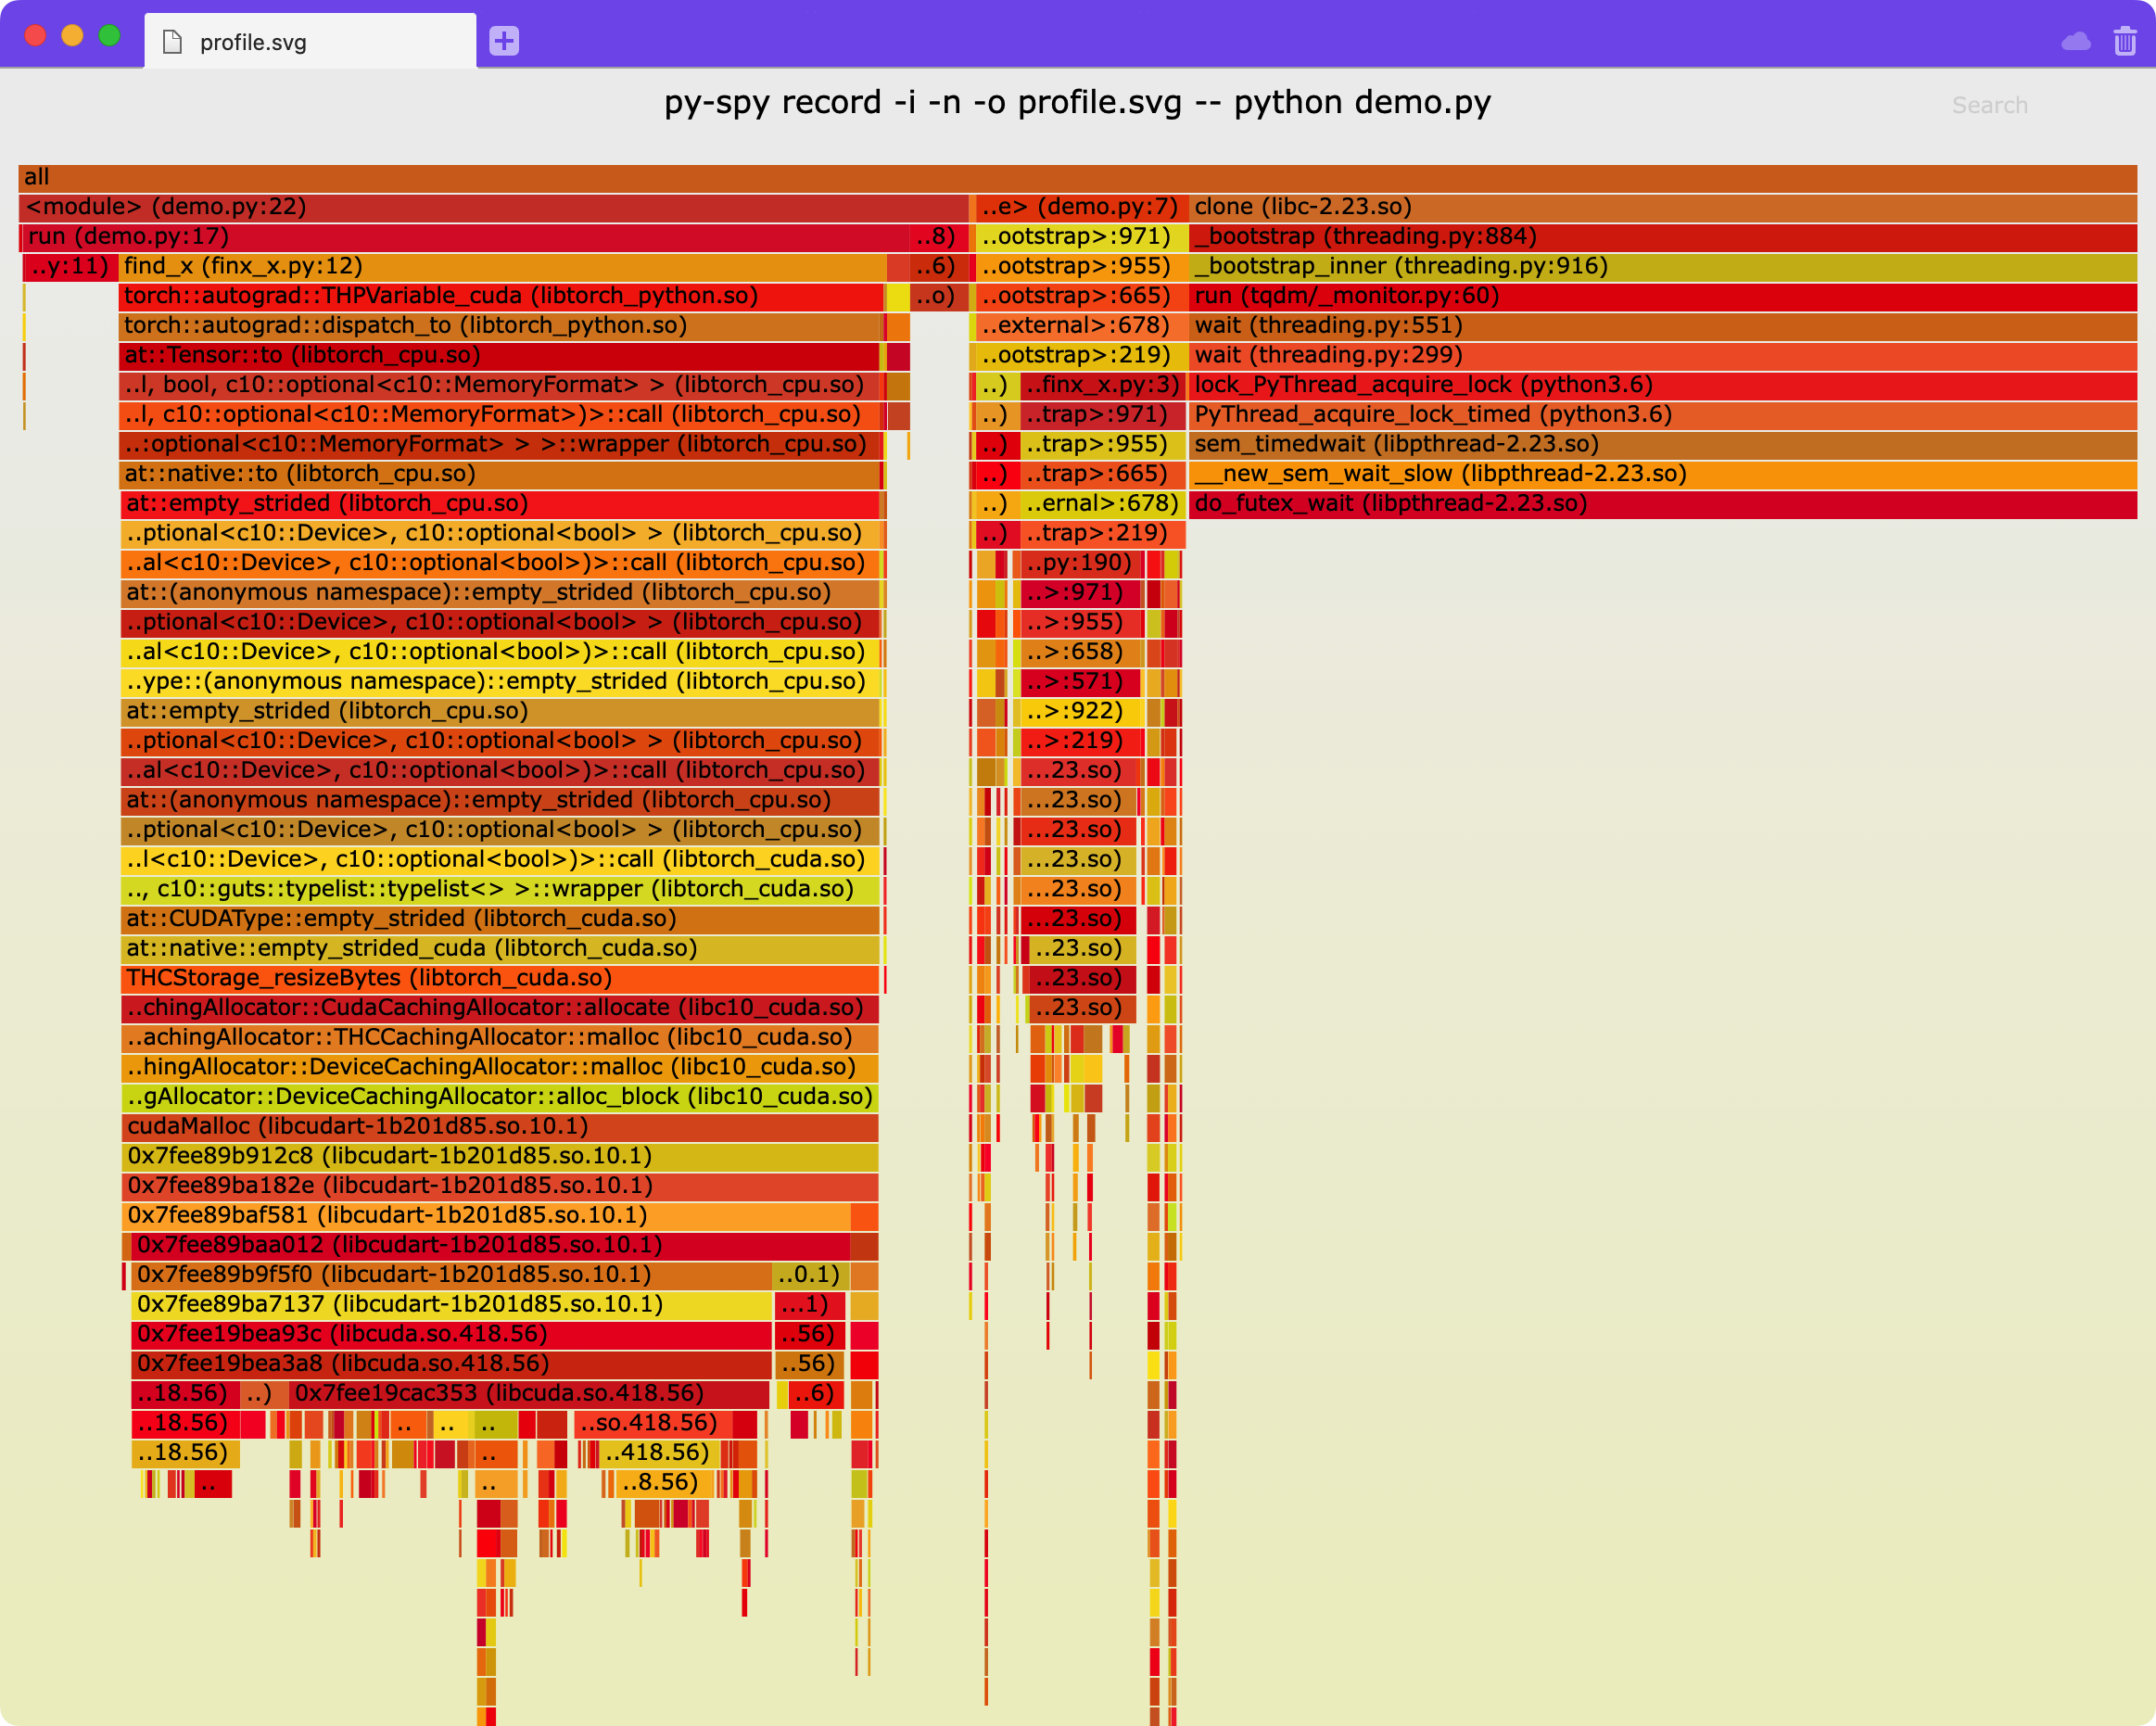
你可以增加-n选项,用来展示更深层的native代码的调用,如下图可以展示torch更详细的调用:
第二种典型用法
第二种用法是针对已经在运行的程序,首先我们找到程序对应的pid,那么就可以直接针对这个进程进行profiling:
1
py-spy record -o profile.svg --pid 30468
因为我们要直接去看另一个进程的状态,所以存在权限问题,按照提示我运行了下面的(最后两个叹号在linux里指的是上一条命令)
1
sudo env "PATH=$PATH" !!
显示
py-spy> Sampling process 100 times a second. Press Control-C to exit.
这意味着我们可以随时暂停,就像之前提到的一样。
我们将输出文件profile.svg下载到本地打开,效果和上面的第一种用法类似
针对卡住的程序——一种迂回方法
有的时候针对于卡住的程序,我们可以直接针对这个卡住的pid进行profiling,看一下时间消耗在哪一行,就是卡在了哪一行。
其他方法
参考项目主页
不足
- 直接针对pid进行profiling涉及sudo权限
- 需要每次重新download profile.svg,很恶心
- 目前无法直接和源代码关联起来,看起来略费劲
小trick
- 可以在shell配置中加入
alias spy="py-spy",将py-spy重命名为spy,这样少打两个字母以及一个横线会很舒服
scalene
官网地址:https://github.com/plasma-umass/scalene
scalene是另一个python包,用的方案和py-spy不太一样,是通过signal来进行时间判断的,是一种没有那么精准的方法(但是据作者说已经足够了,我也验证过,日常使用没有问题)。
我们还是需要先安装
1
pip install -U scalene
不足
我们这次先说不足,因为里面有一条会影响我们后面添加的一个参数
-
针对memory的profiling不支持python3.6和python3.7,如果直接使用,则会提示:
AttributeError: module 'threading' has no attribute '_shutdown_locks_lock',所以,我们一般要加上--cpu-only,这虽然说的是cpu,但是经过测试,gpu的时间也会被考虑,只是不考虑内存而已。当然,支持mem本就是scalene的特色功能(py-spy是否支持没细看)。 -
火焰图可以更清晰地展示调用关系,某些情况下会更好看
-
scalene区分了python代码时间、非python代码时间和系统调用时间,需要适应(不算缺点)
-
直接针对pid进行profiling涉及sudo权限(同py-spy)
用法
直接运行下面的程序
1
scalene demo.py
(就像之前说的,要是是python3.6使用,要加上--cpu-only )
完事儿会默认打开浏览器,通过网页形式展现,如图(这里我注释掉了torch那一行,因为我本机没有gpu)
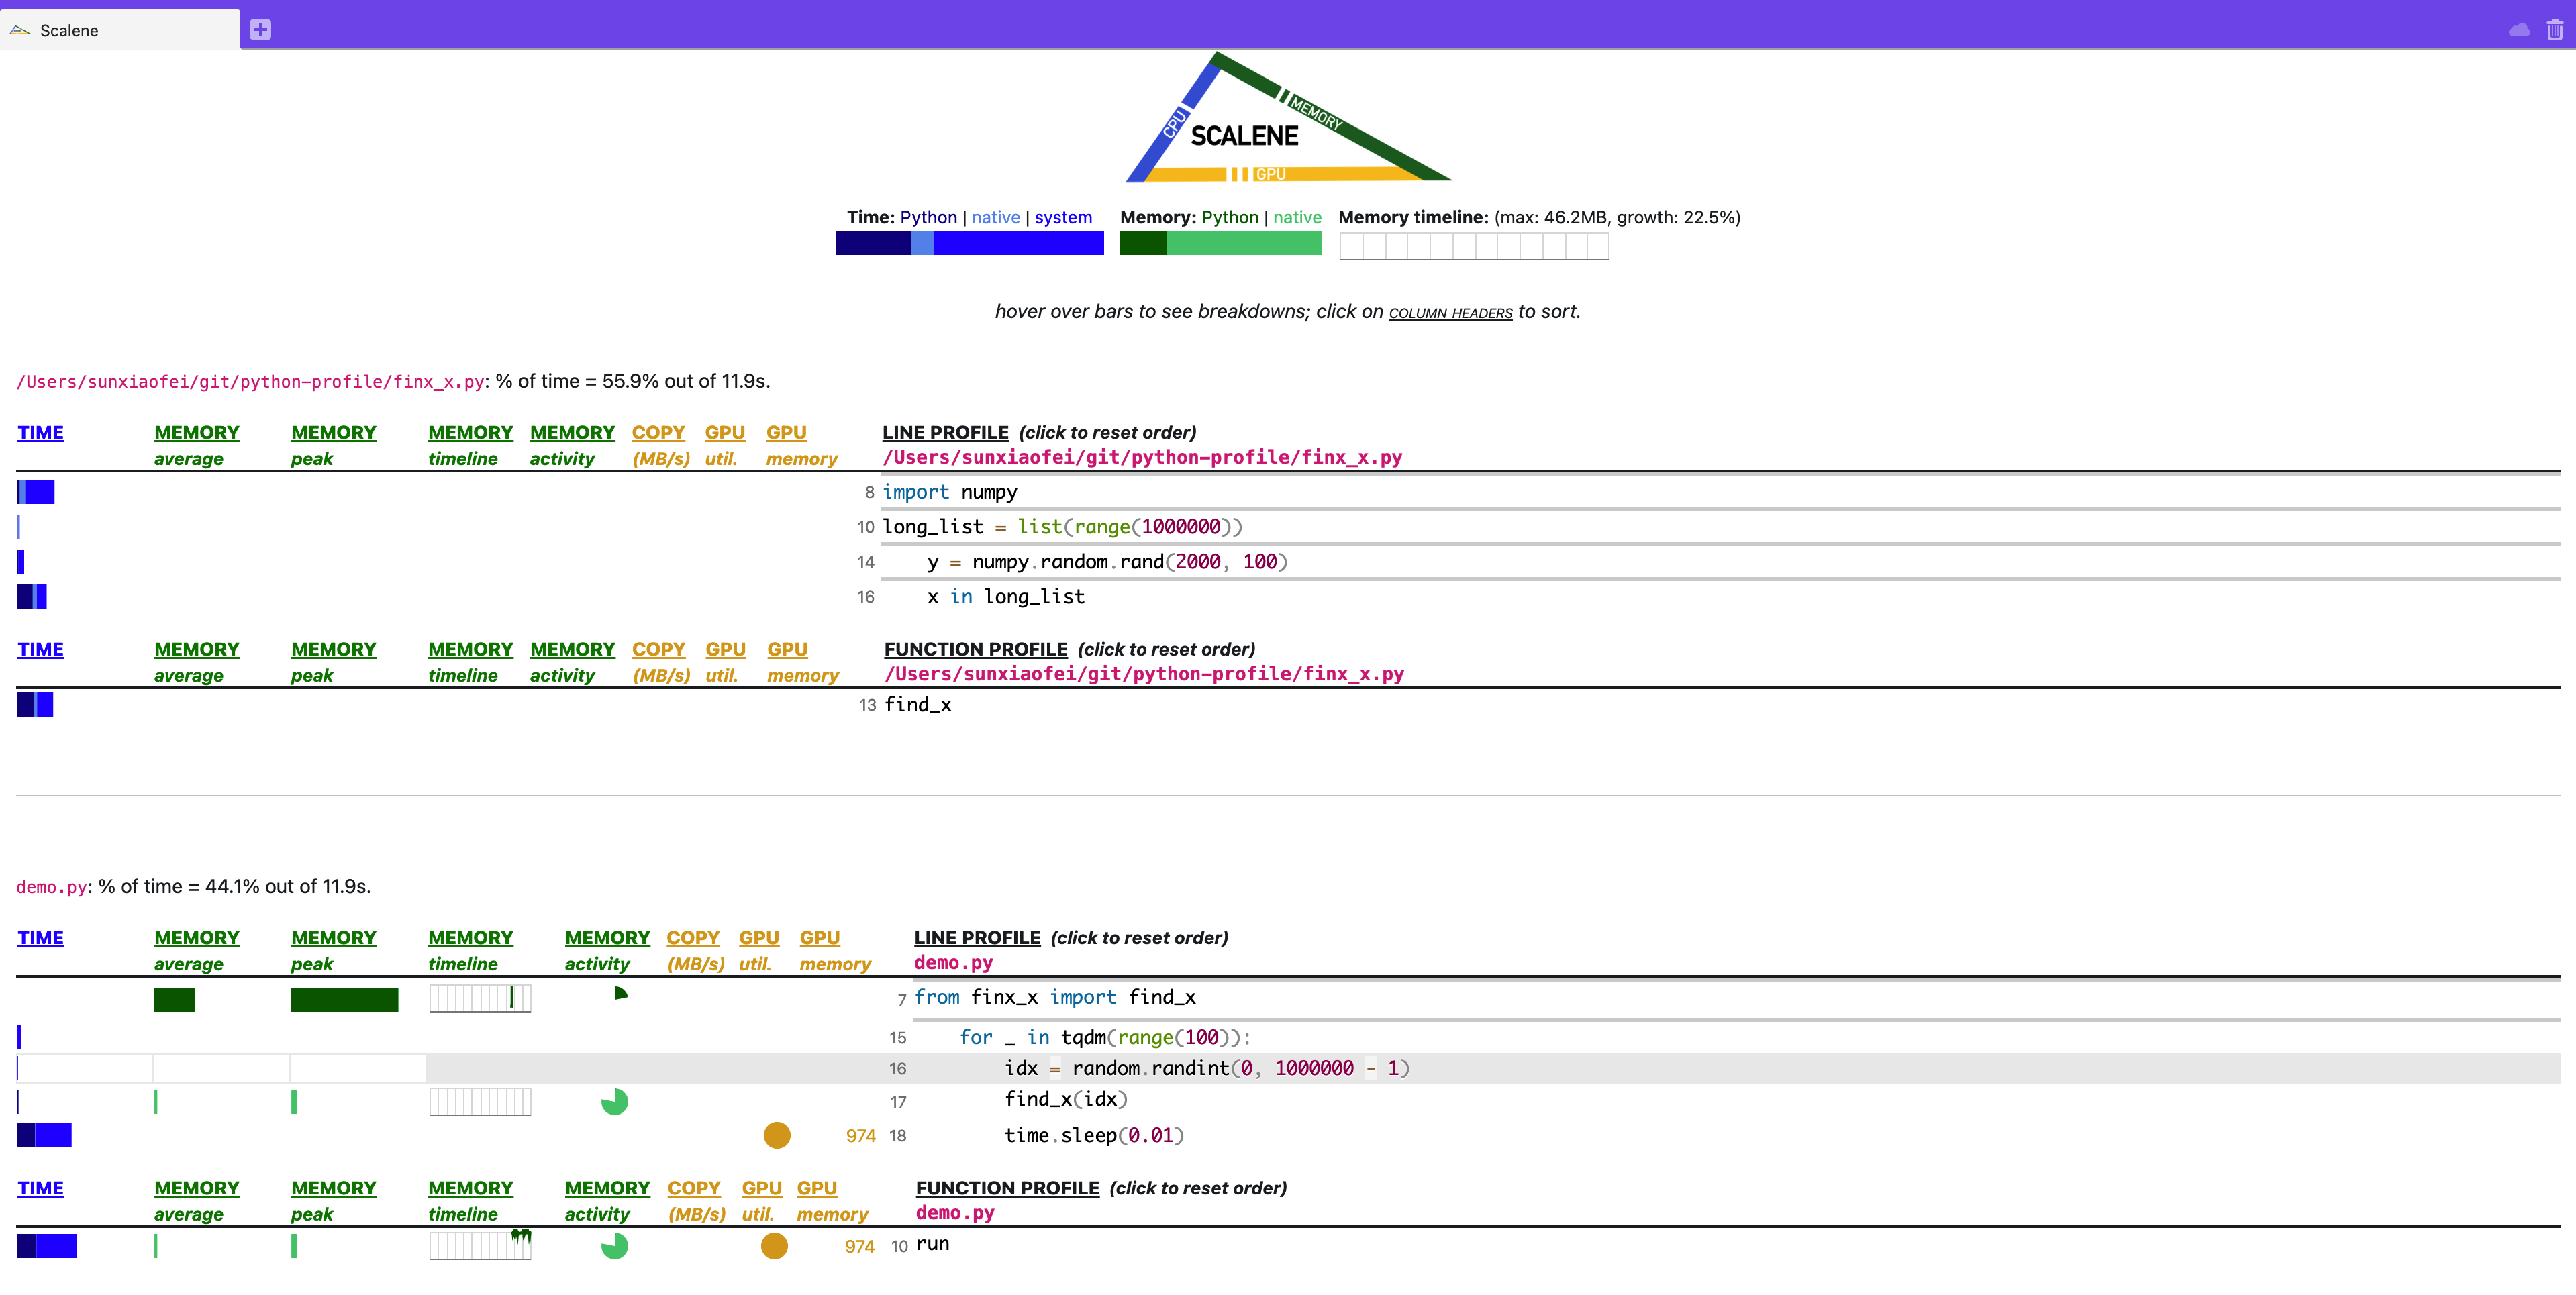
各项信息都很清晰,可以说是相当现代的一种profiling。
可以通过添加--cli实现直接在terminal里展示(对于服务器不需要),更适合在服务器上使用(当然网页也可以,开个端口就好,再说,再说……)
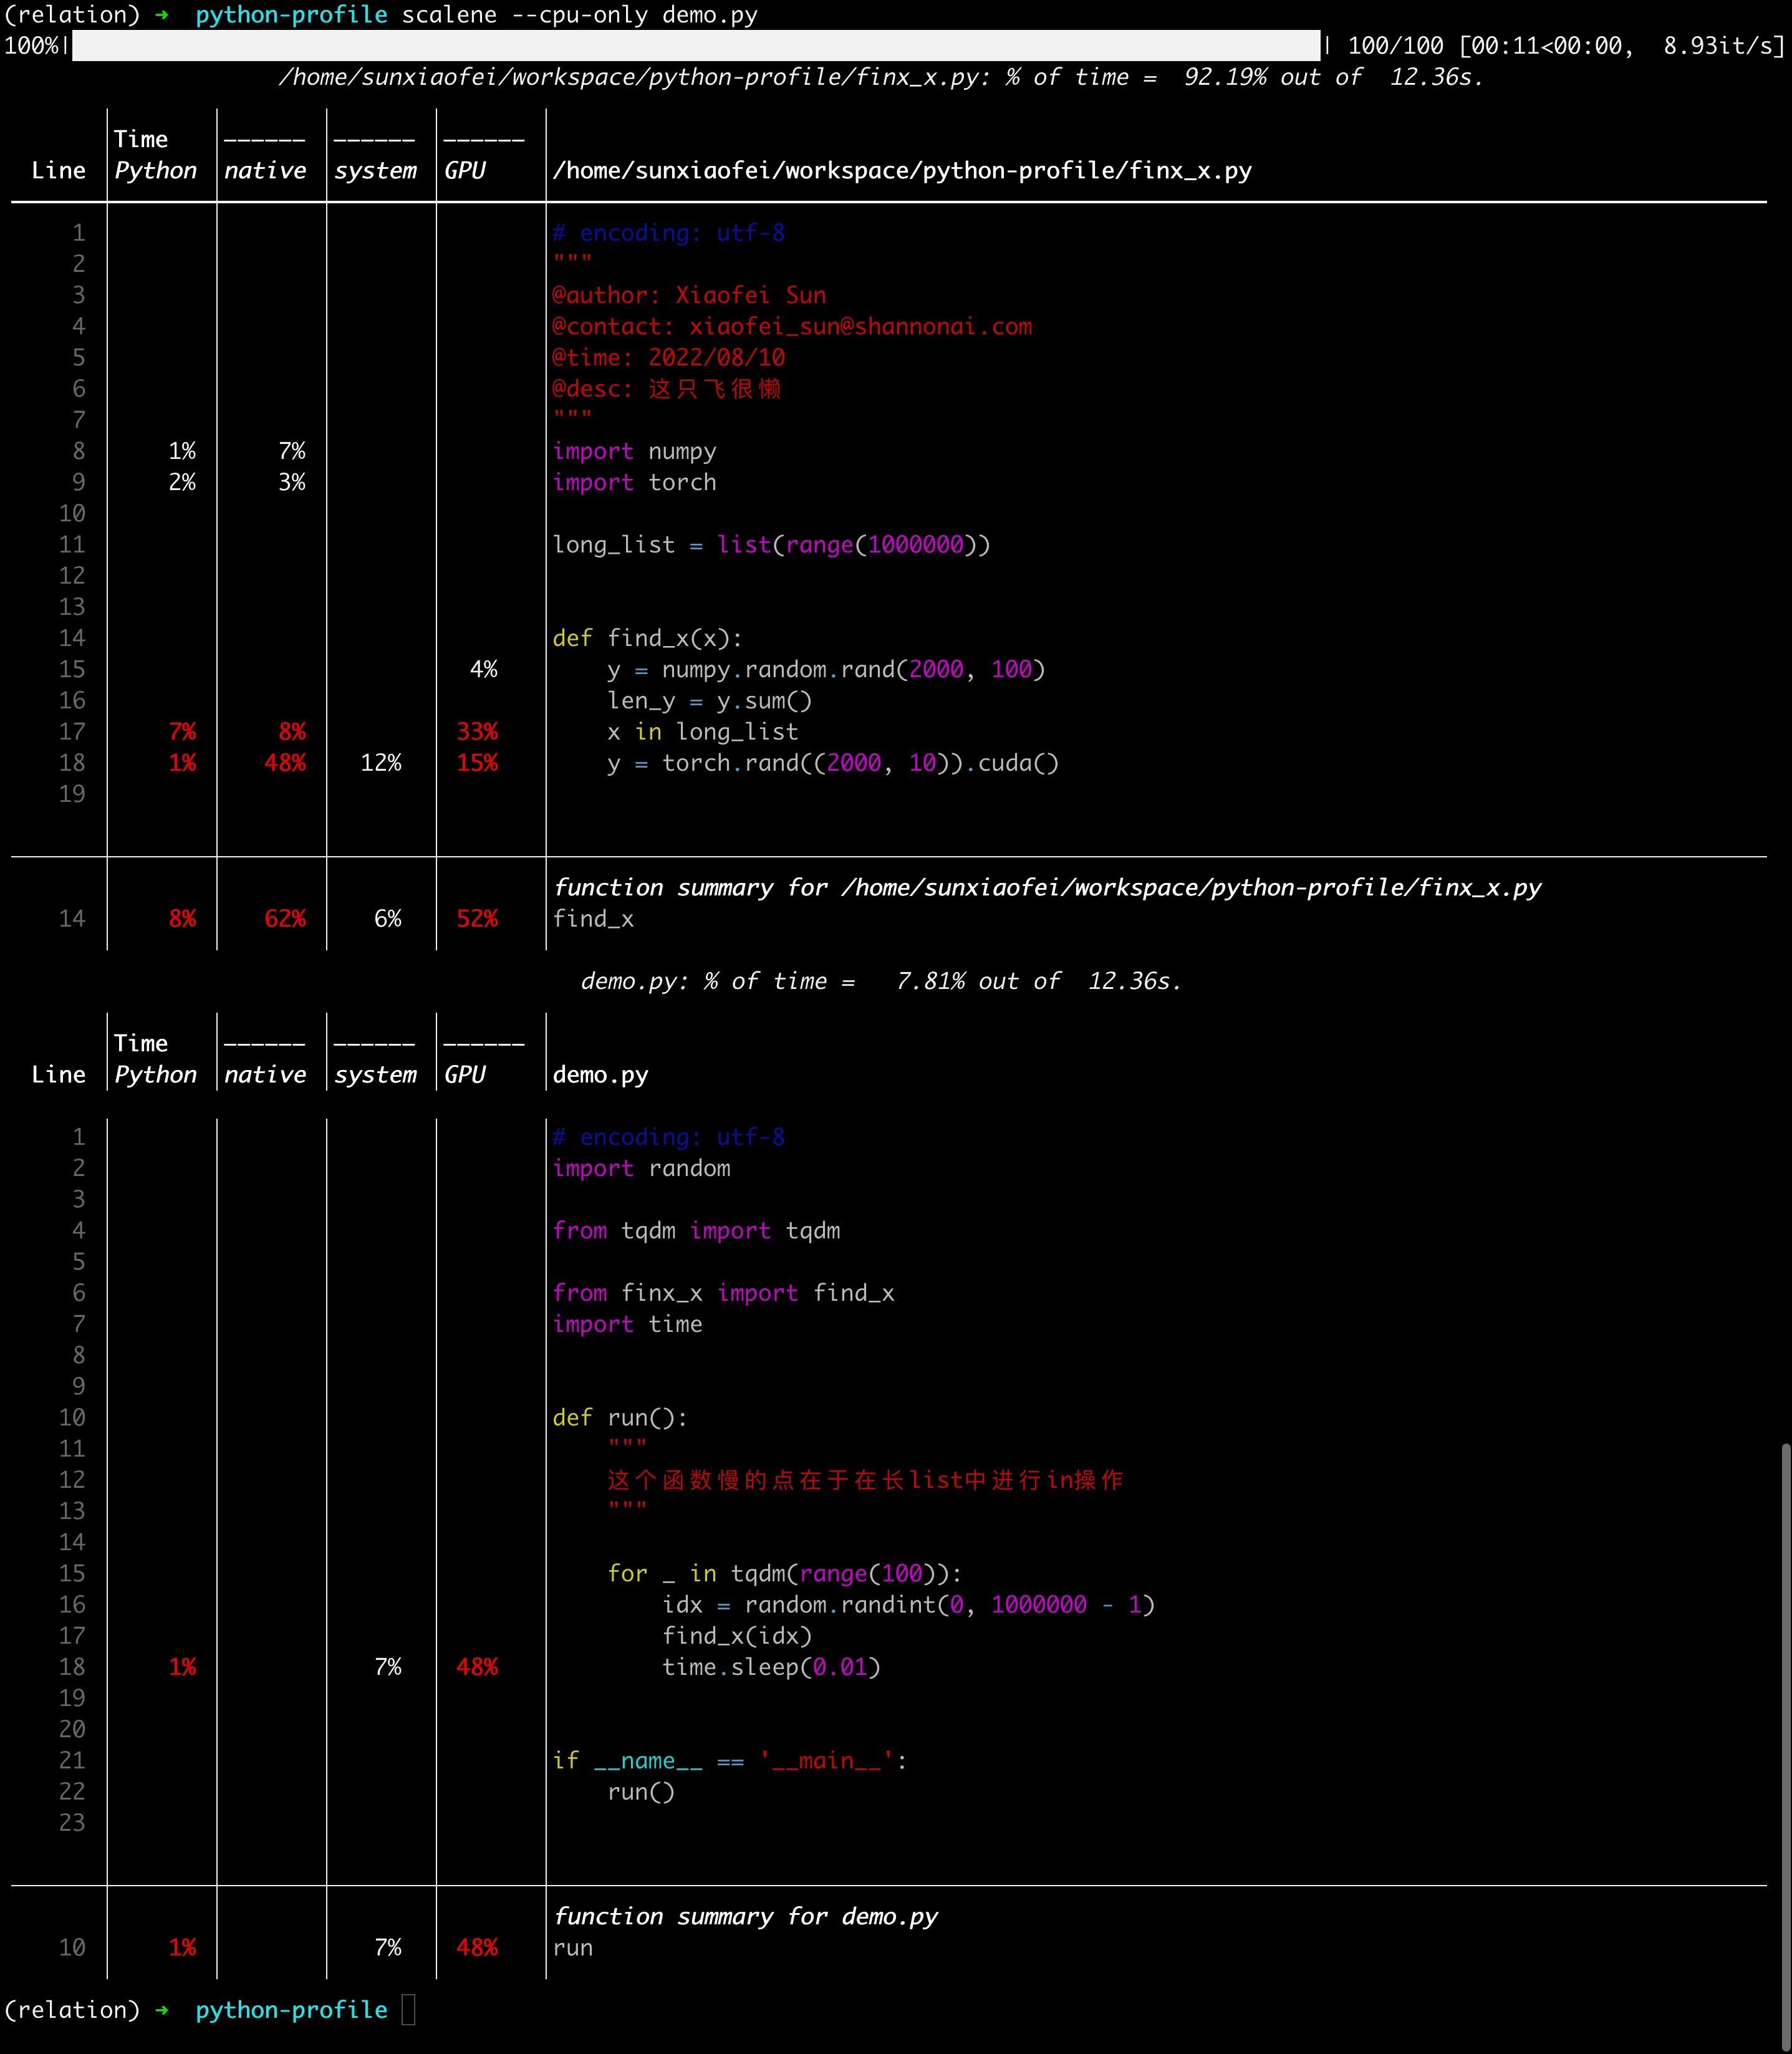
还是很清晰的
这里可以关注一下time.sleep这一行,看到是system时间较多
当然,这里不好的一点是没有一个总的时间的展示(网页端的累积图有),就比较烦,感觉还是有一个总的网页端比较好
这里不太好的一点是,没有展示初始化long_list的时间,原因待定
但是比py-spy好的一点是,清晰展示了sleep时间
时间列意义
这里要注意的是,web 界面的TIME部分,是分成三个组成部分的,分别是python、native和system,对应terminal的三列,这三列的意思分别是:
- python:python语言代码耗费时间
- native:非python代码(典型的比如c语言代码)耗费时间
- system:系统调用时间
这三列加起来,才对应的是运行时间,也就是py-spy里的占比,不能但看一项(这一点不好说是好是差,所以没有放到不足里说,但是终究需要
一点疑问
为什么x in long_list这句话的GPU活动那么多
建议
| 我们关心的特征 | line-profiler | py-spy | scalene |
|---|---|---|---|
| 非侵入式修改 | ❌ | ✅ | ✅ |
| 一键profile | ❌ | ✅ | ✅❌ |
| 针对已运行程序profile | ❌ | ✅ | ✅ |
| 运行速度影响较小 | ❌ | ✅ | ✅ |
| 结果清晰 | ✅ | ✅❌ | ✅ |
可以看到,以上三种工具,scalene是最为全面的,几乎包含所有我们需要的特性,所以大多数情况下,我们希望使用scalene:
-
一般情况下,直接使用scalene:
scalene --cpu-only demo.py,此时展示的是当前目录下代码相关的profile -
若自己写的项目较大,可以加上
--reduced-profile参数,意为只保留瓶颈部分的代码:scalene --cpu-only --reduced-profile demo.py --profile-all参数慎用,结果会非常有冗长,若需要使用,建议配合--profile-only参数使用,从而对文件进行筛选- 若需要清洗看到调用关系和占比,再使用py-spy