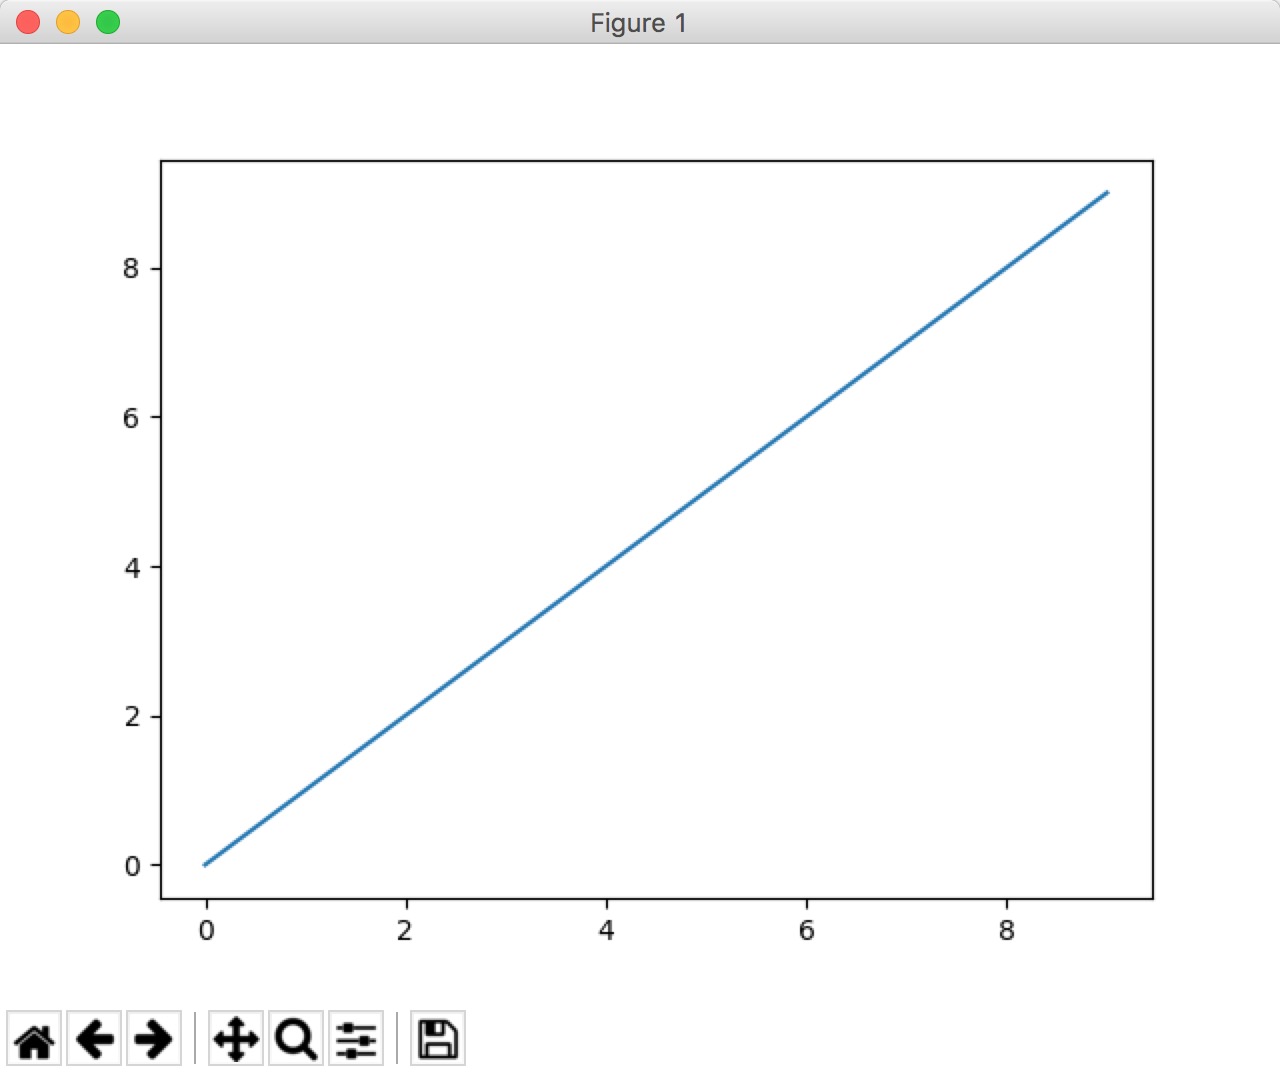
For lots of data scientist or ML researchers, matplotlib, the popular Python-based graphing library, is one of the most useful tool for visualization. For example, use the code below can draw a straight line.
1
2
3
4
from matplotlib import pyplot as plt

plt.plot(range(10))
plt.show()
However, we want to use server to handle big dataset or use GPU server to accelerate deeplearning traning sometimes. In either situation, trouble occurs if we want to visualize our results.
Typically, there are two ways to solve this problem. On the one hand, you can searialize your data to plot, then download it and plot with your PC or show it through mpld3; on the other hand, we can find some way to plot on server and display on our own PC, which is what we want to show in this blog.
Through PyCharm
This way may be the most natural way: through PyCharm’s remote interpreter to run your code and it will show the plot directly on PyCharm.
To achieve this goal, you need first add an ssh interpreter and second just run your code.
Add remote interpreter Google
pycharm remote interpreteror just click Configuring Remote Interpreters via SSH - Help | PyCharm then you can find all I said here
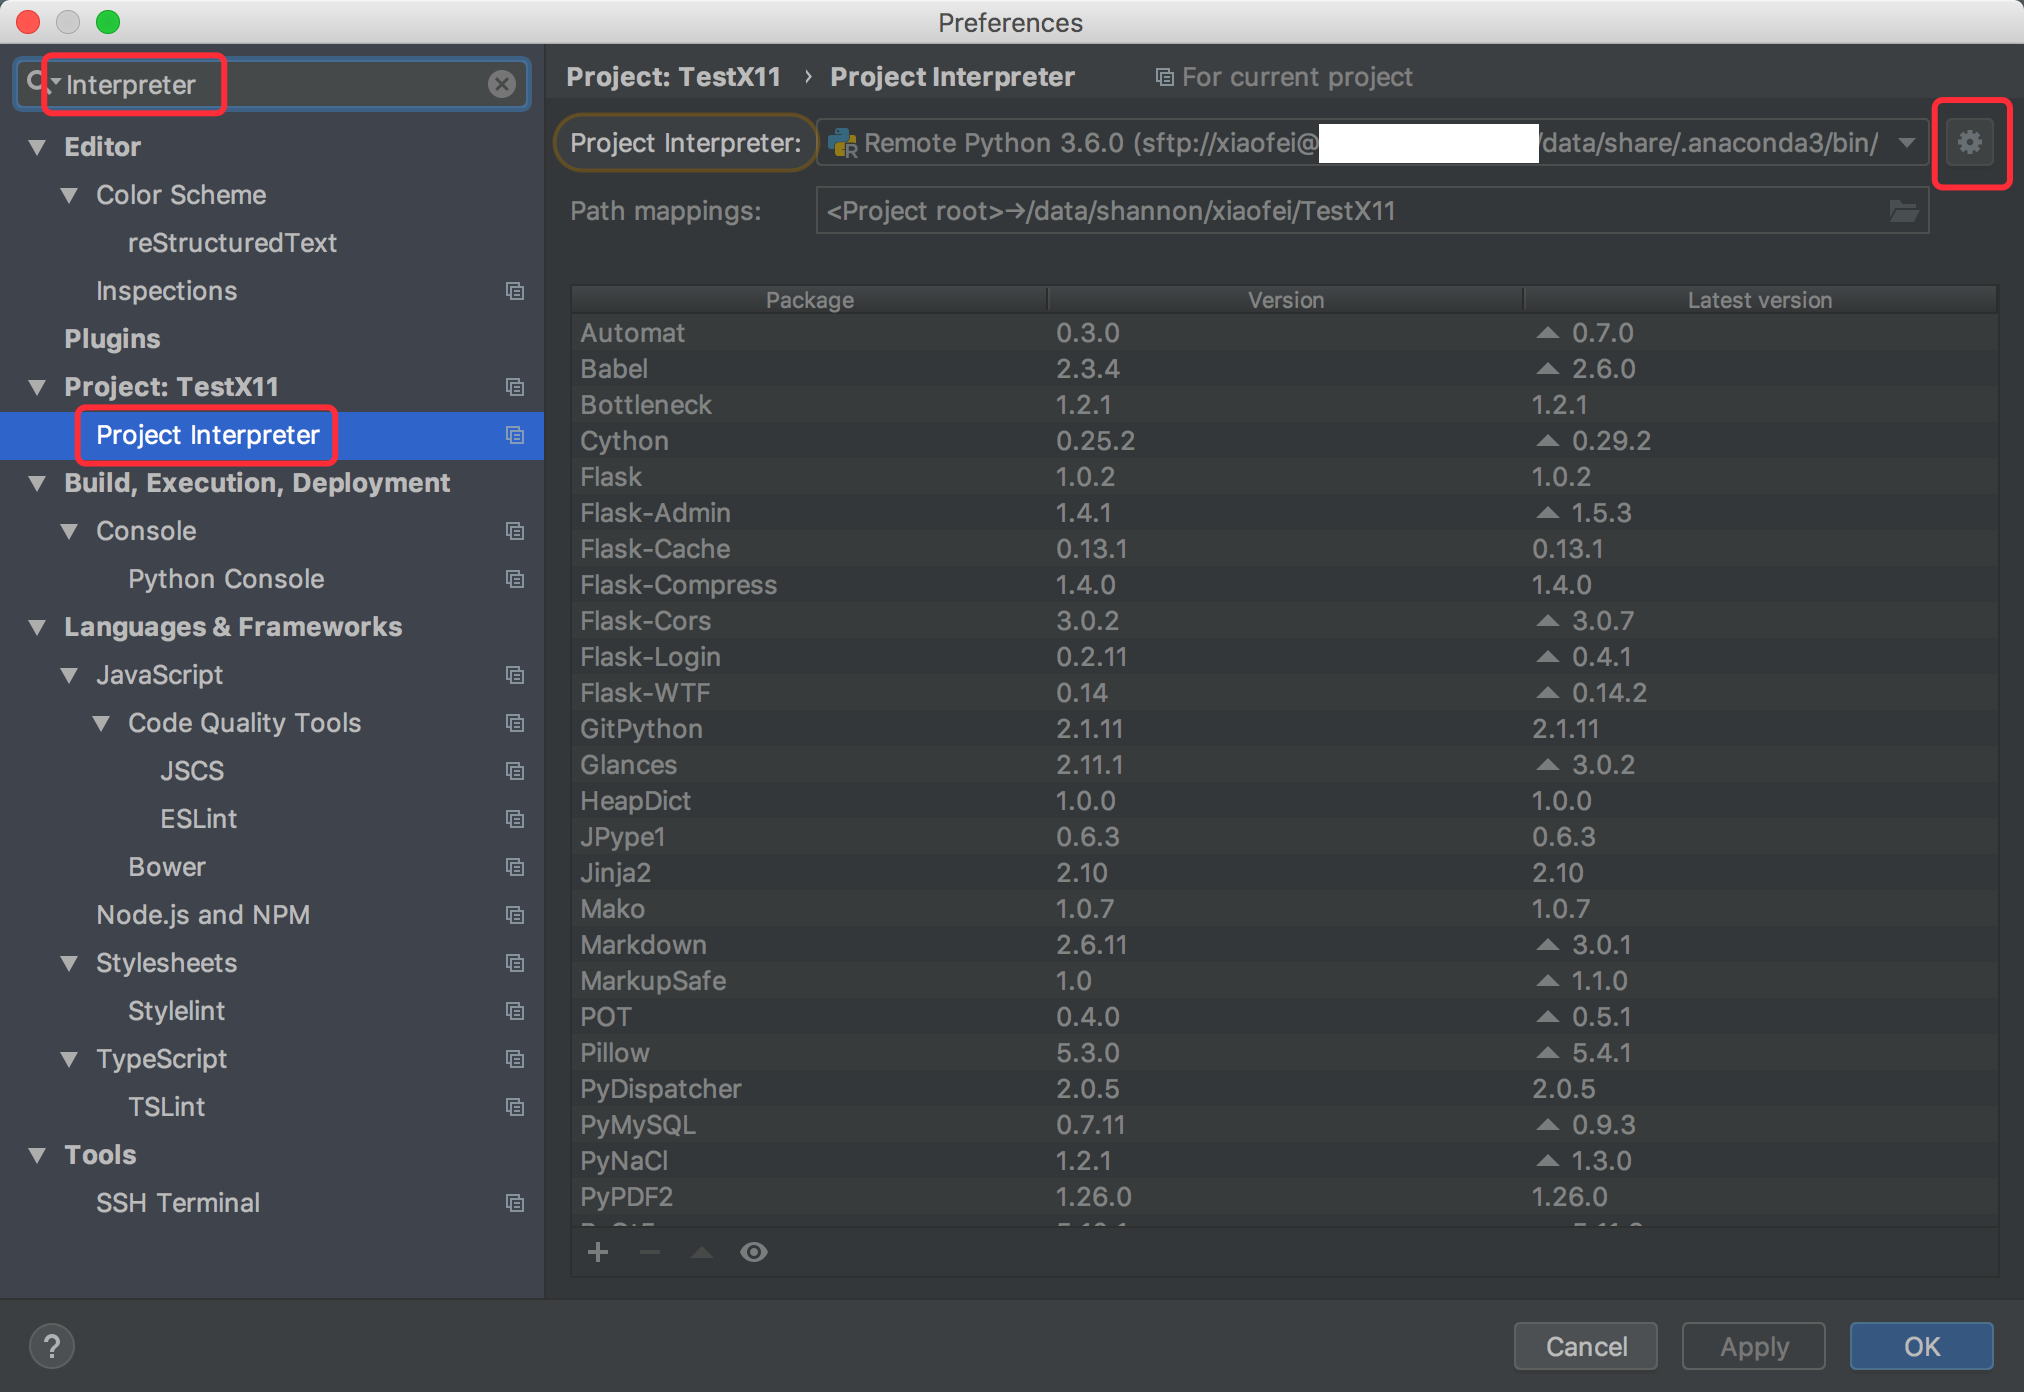
- In PyCharm Preferences, input
Interpreterto find Project Interpreter paged, then lick the gear icon in top right- Click “Add”, then choose
SSH Interpreteron left- Input all information
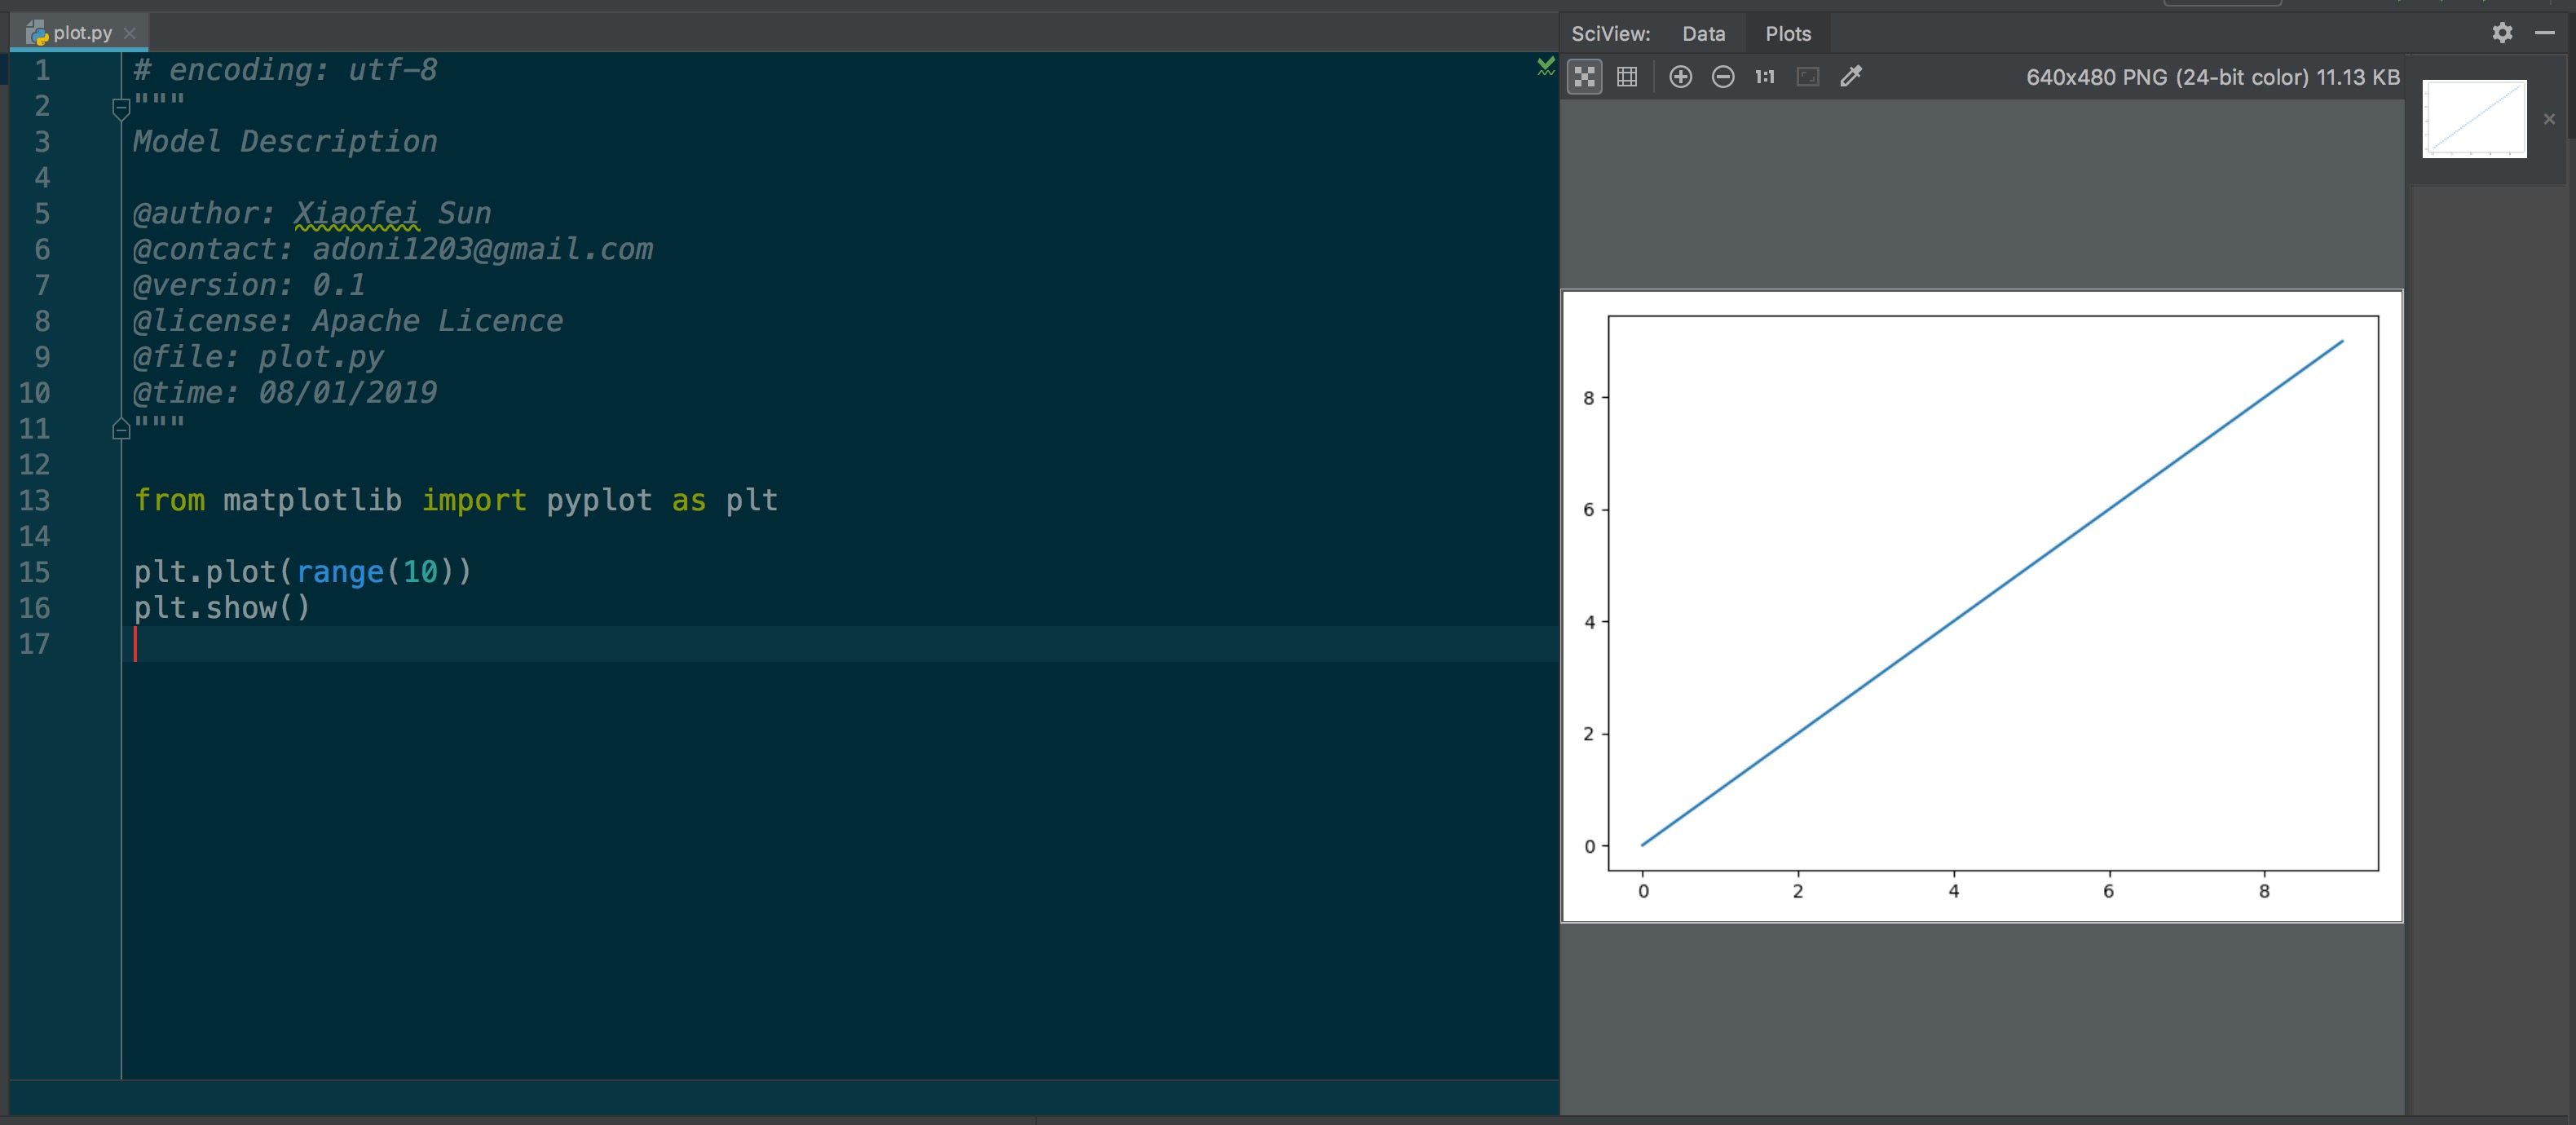
Then you can run your code and PyCharm will show the result automatically on the screen.
Through X11
According to wikipedia:
The X Window System (X11, or simply X) is a windowing system for bitmap displays, common on Unix-like operating systems.
Usually, through ssh and terminal, computer can only show text on server. However, through X11, we can display images and other files. Even interactivity can be done through X11. In a nutshell, you can imagine it as a GUI for remote server.
There are four steps to use X11 to show plots drawn on server.
- Download and install X11. For macOS users, you can download from XQuartz.
- Open X11 (in my computer, X11 will be opened automatically when I run step 3, but I’m not sure about it will happen in all computers)
- Open X11 forwarding by adding
-Xwhen you use ssh. So if you used to login server byssh yourname@host -P port, now you should usessh -X yourname@host -P port. - Run any python code like what you do in your own PC. The result will show on your desktop.
Hopefully after you do that you will see this window:
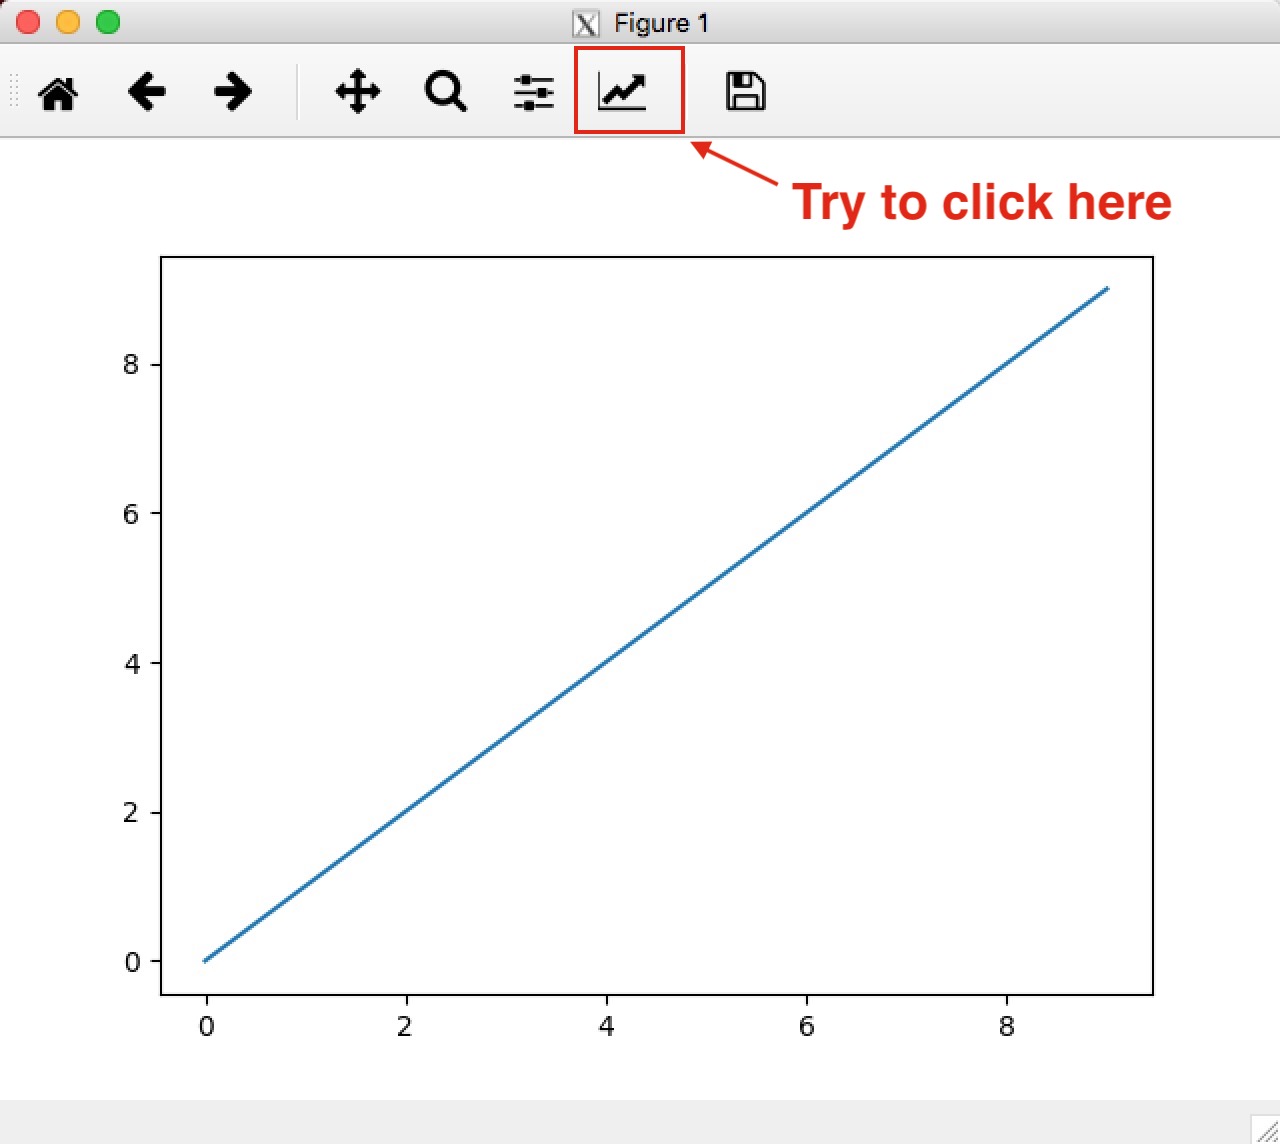
This window is almost identical to what we show in the very beginning of this blog, except that you will see an X11 icon in the window title. Also, note that this window is an interactive one, which is at opposite poles with images shown in PyCharm. We can click the icon marked above to add title or add label; the left icon will enable you to change the figure layout.
Through Jupyter Notebook
This is a cliche because Jupyter is a web app and supports inline plots. So it avoid the dilemma that matplotlib need GUI environment as it use webpage to show images.